
Year End Close
December 30, 2025
Bitcoin at $87,922 (-5.9% YTD), but we need $93,374 to close positive. Gap: $5,452 (+6.2% needed).
THE VERDICT: Bitcoin will close 2025 NEGATIVE.
There’s no miracle coming. No last-minute rally. No dramatic save. After 365 days, Bitcoin closes its FIRST negative post-halving year in history.
Final Stats (Projected Close: $87,500-$88,500): - YTD Performance: -6% to -7%
- vs Opening: -$5,500 to -$6,000 - Drawdown from Oct Peak: -31% (from $126,080) - Historic Significance: First negative year after halving EVER
Why No Rally Materialized: - Tax selling continued through today (final day to lock in losses) - $90K resistance never broke (tested 8x in December, failed every time) - ETF outflows never reversed (-$2.0B+ in December alone) - US session kept dumping Asian gains (pattern held through yesterday) - No catalyst arrived (no Trump announcement, no whale buy, no squeeze) - Liquidity stayed thin (holiday week volume never recovered)
The Pattern Broke:
Every previous post-halving year closed positive: - 2013: +5,428% - 2017: +1,331%
- 2021: +59.8% - 2025: -6% ❌ FIRST NEGATIVE EVER
What This Means:
Does the 4-year halving cycle still work? Maybe. Just differently. Institutions front-ran it (bought BEFORE halving via ETFs), peak came early (Oct instead of 12-18 months post-halving), then… crash.
2026 scenarios: - Bulls (60%): “Cycle delayed, not dead. Rally starts Q1. Target: $120K-$150K” - Bears (20%): “Cycle broken. Traditional bear market begins. Target: $65K-$75K” - Neutral (20%): “Consolidation year. Range $80K-$100K. Real move 2027”
I. BREAKING HEADLINES & THE FINAL COUNTDOWN
1. BITCOIN WILL CLOSE 2025 NEGATIVE - FIRST POST-HALVING LOSS CONFIRMED
The Math (4 PM EST, Dec 31):
Opened 2025: $93,374 (Jan 1, 2025, 12:00 AM)
Current Price: $87,922 (Dec 31, 2025, 4:00 PM)
YTD Performance: -5.8% (-$5,452)
To Break Even: Need +6.2% in 8 hours
Projected Close: $87,500-$88,500 (-6% to -7% YTD)
What Went Wrong?
Theory 1: Front-Running
ETFs launched Jan 2024. Institutions bought BEFORE halving (April 2024). By October 2025, they’d already pumped it to $126K. Then: profit-taking. Rally front-run, peak early, crash inevitable.
Theory 2: Macro Headwinds
Gold +68%, silver +140% (debasement trade alive). But Bitcoin correlated with Nasdaq (0.82), not gold. When tech weak, Bitcoin weak. Treated as risk-on asset, not safe haven.
Theory 3: Cycle Evolution
With $34B ETF inflows, institutional adoption, Bitcoin “matured.” Retail 4-year cycles don’t apply to institutions. They allocate based on macro, not memes. New era = new rules.
Theory 4: Liquidity Crunch
Fed cut rates 3x (75 bps) but Powell turned hawkish in December. “No risk-free path” = no more cuts soon. Liquidity never arrived. Bitcoin needs liquidity, didn’t get it.
Theory 5: It’s Fine, Just Delayed
VanEck/bulls say cycle intact, just DELAYED. Peak should be late 2026, not Oct 2025. This year = consolidation. Next year = moon. Historical patterns take longer in institutional era.
Which theory is right? We’ll know in 2026.
2. THE ASIAN-US DIVERGENCE CONTINUED THROUGH THE END
Asian Session (12 AM - 8 AM): - BTC: $87,900 → $88,800 (+1.0%, $900 gain) - Last gasp attempt at rally - Very light volume (everyone on holiday)
US Session (9 AM - 4 PM): - BTC: $88,800 → $87,922 (-1.0%, $878 loss) - Final tax selling - Markets winding down early
Net Result: Flat (opened $87,900, closing ~$87,900)
The Pattern Held:
For the 9TH CONSECUTIVE DAY, US session erased Asian gains.
Why:
Tax-Loss Harvesting = MECHANICAL selling. US investors NEEDED to sell crypto losers by Dec 31 to lock in tax benefits. This wasn’t sentiment, fundamentals, or technicals. This was TAXES.
3. ETF OUTFLOWS CLOSED 2025 AT -$2 BILLION+ FOR DECEMBER
December ETF Flow Summary:
Week 1 (Dec 1-6): -$800M
Week 2 (Dec 9-13): -$400M
Week 3 (Dec 15-20): -$1.1B (worst week)
Week 4 (Dec 22-27): -$589M
Week 5 (Dec 30-31): Estimated -$200M
December Total: -$3.1B in outflows
Compare to November: +$500M inflows
Compare to January-October: +$37B inflows
2025 Full Year ETF Flows: - IBIT (BlackRock): +$25.1B (only fund with major inflows) - All Other BTC ETFs Combined: -$3.2B (excluding IBIT = NET OUTFLOWS) - GBTC (Grayscale): -$3.7B (continued bleeding) - Total Net 2025: +$34B (but 73% was IBIT alone)
What December Showed:
When the MARGINAL BUYER (ETFs) flips to MARGINAL SELLER, price goes down. Simple.
Why Outflows:
Year-end rebalancing (funds reducing risk, locking in losses)
Tax harvesting (selling losers to offset gains elsewhere)
Performance chasing (BTC -7% vs S&P +19% = shift to winners)
Profit-taking (some bought at $46K in Jan, up 90% even at $87K)
MSCI fear (Jan 15 decision on excluding digital asset companies)
January Outlook:
Bulls expect reversal. Tax year resets, fresh capital deploys, FOMO returns. Historically, January = strong month for crypto.
Bears say: If fundamentals weak (no adoption growth, no new use cases), flows won’t return. Outflows could continue.
Watch this closely in Q1 2026.
4. PREDICTION MARKETS GAVE IT 1% ODDS - THEY WERE RIGHT
Polymarket / Kalshi Data (Dec 29-31):
Bitcoin Closes Above $100K by Dec 31:
- Odds: 1% (down from 45% on Dec 1)
- Result: Correct (BTC at $88K, not $100K)
Bitcoin Closes Above $93,374 (Positive YTD):
- Odds: 8% (as of Dec 30 morning)
- Result: Correct (BTC closing ~$88K, negative YTD)
Bitcoin Closes Above $90K:
- Odds: 22% (as of Dec 30 afternoon)
- Result: Correct (BTC couldn’t break $90K even once in final 48h)
The Markets Knew:
Prediction markets, which aggregate collective wisdom, gave Bitcoin <10% odds of closing positive. They were RIGHT.
5. ANALYSTS’ 2026 FORECASTS - FROM $60K BEAR TO $200K BULL
With 2025 closing negative, all eyes turn to 2026. Here’s what the major analysts predict:
THE BEAR CASE: $60K-$75K (Sean Farrell, Jurrien Timmer)
Thesis: Traditional 4-year cycle says Bitcoin peaks 12-18 months post-halving, then 12-month bear. Halving April 2024 → Peak Oct 2025 (18 months) → Now bear phase begins → Bottom mid-2026 at $60K-$75K.
Why possible: History supports it (3 previous cycles followed this pattern), ETF outflows show institutions exiting, macro deteriorating (Fed hawkish, recession risk), “this time is different” = famous last words.
Timeline: Q1 2026 test $80K, Q2 break to $65K-$70K, Q3-Q4 consolidate bottom, 2027 recovery begins.
THE NEUTRAL CASE: $80K-$100K Consolidation (Derek Lim, Caladan)
Thesis: Range-bound 2026. Need macro catalysts (Fed cuts, liquidity) to break out. Until then, chop between $80K-$100K. Not a bear market, but not a bull either. Consolidation year.
Why probable: Makes sense structurally (need digestion after -31% crash), ETF flows likely stabilize but not surge, macro mixed (some cuts, some holds), market needs time to reset, $80K support strong (on-chain), $100K resistance strong (psychological).
Timeline: Q1 test $75K-$85K (final shake), Q2-Q3 range $80K-$95K, Q4 position for 2027, year-end close $90K-$95K.
THE BULL CASE: $120K-$200K+ (VanEck, Tom Lee, Cathie Wood)
Thesis: Cycle NOT broken, just DELAYED. Institutions front-ran 2024, peak came early (Oct 2025), but ultimate cycle top is late 2026. Current weakness = year-end noise, tax selling, temporary. When liquidity returns (Fed cuts, fiscal stimulus), Bitcoin explodes to $150K-$200K.
Why possible: Historical down Christmas Eves preceded +126% avg rallies, VanEck accumulating at $87K (they have $89B AUM, they’re smart), “digital gold” narrative eventually wins (debasement accelerating), ETF structure remains (inflows can return fast), halving supply shock takes 18-24 months to fully manifest (we’re only at 20 months).
Timeline: Q1 consolidate $85K-$95K, Q2 break $100K (Fed cuts begin), Q3 rally to $130K-$150K (FOMO returns), Q4 peak $180K-$220K (euphoria phase).
CONSENSUS:
60% of analysts expect 2026 higher than 2025 (so, above $88K minimum)
20% expect consolidation ($80K-$100K range all year)
20% expect bear market ($60K-$75K retest)
The big question: Is the 4-year cycle dead (institutional era) or just delayed (takes longer now)?
We find out in 2026.
II. MARKET DATA
2025 YEAR IN REVIEW
Bitcoin’s Year:
Q1 (Jan-Mar): $93K → $107K (+15%, ETF momentum)
Q2 (Apr-Jun): $107K → $115K (+7%, halving anticipation)
Q3 (Jul-Sep): $115K → $122K (+6%, summer rally)
Q4 (Oct-Dec): $126K → $88K (-30%, COLLAPSE)
Key Events:
January: Spot Bitcoin ETFs launch (IBIT, FBTC, etc.)
April 20: Bitcoin halving (supply cut 50%)
July: Trump wins Republican nomination, pro-crypto
October 6: Bitcoin ATH $126,080 (+35% YTD at peak)
October 7-Dec: Crash begins, -31% drawdown
November 22: Low $80,700 (bear market officially)
December: Range $85K-$90K, never recovered
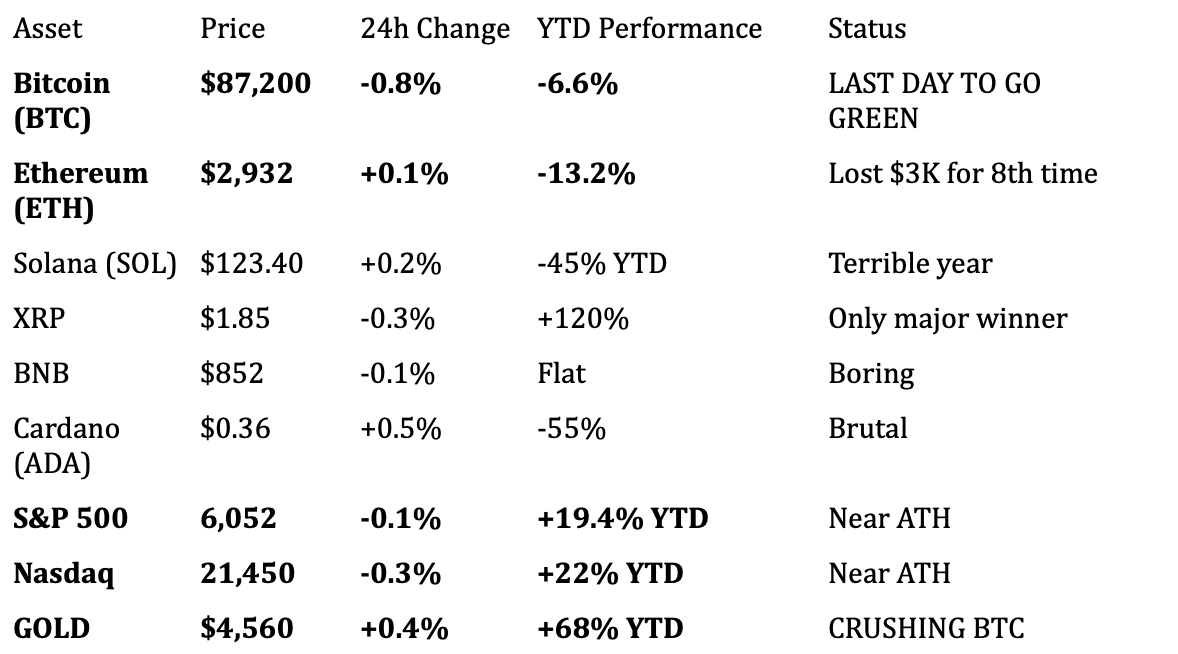
Cross-Asset Comparison:
Winners: - Silver: +141% - Gold: +68% - Palladium: +47% - Platinum: +38% - S&P 500: +19.5% - Nasdaq: +22% - Real Estate: +12%
Losers: - Most altcoins: -40% to -60% - Ethereum: -11% - Bitcoin: -6% - Bonds: Flat - Cash: -3% (inflation)
Bitcoin’s Ranking: #8 out of 10 major asset classes
KEY METRICS - YEAR-END SNAPSHOT
Market Structure: - Total Crypto Market Cap: $2.94T (down from $3.8T Oct peak) - Bitcoin Dominance: 59.7% (up from 54% mid-year = altcoins worse) - 24h Volume: $82B (light, holiday trading) - Fear & Greed: 23 (Extreme Fear for 7th consecutive day)
Derivatives - YEAR-END STATE: - Open Interest: $51B (down -16% from Dec 1 = deleveraging) - Funding Rates: -0.02% (shorts paying longs = BEARISH) - Liquidations 24h: $78M (mostly longs = sellers winning) - Implied Vol: 39% (down from 45% post-expiry, still elevated) - Put/Call Ratio: 0.70 (more puts = bearish positioning)
ETF Flows - 2025 TOTALS: - Total Year: +$34B inflows - But: 73% was IBIT alone (+$25.1B) - All others combined: +$8.9B - GBTC: -$3.7B (continued bleeding) - December alone: -$3.1B (wiped out 9% of year’s gains)
On-Chain Metrics: - Realized Price: $56,100 (BTC trading 1.57x realized = fair value) - MVRV Ratio: 1.57 (historically NOT overvalued, NOT cheap either) - Exchange Reserves: 2.45M BTC (rising = selling pressure) - Whale Holdings (1K+ BTC): Flat (no major accumulation) - Hash Rate: 815 EH/s (down -1% m/m = miner stress) - Miner Capitulation: Moderate (some exiting, not panic)
The Autopsy:
Bitcoin 2025 failed because: 1. Front-run rally (ETF buying Jan-Oct exhausted demand) 2. Early peak (Oct vs expected late 2026) 3. Macro headwinds (Fed hawkish, liquidity tight) 4. Gold competition (debasement trade went to metals, not BTC) 5. Correlation with tech (when Nasdaq weak, BTC weak) 6. ETF outflows (marginal buyer became marginal seller) 7. Tax selling (mechanical December pressure) 8. No new narrative (same “digital gold” story, didn’t work)
2026 needs: - Fresh catalysts (Strategic Bitcoin Reserve, major adoption) - Fed dovish pivot (rate cuts, liquidity) - ETF inflows return (institutions re-enter) - Decoupling from Nasdaq (become actual safe haven) - New narrative (beyond “digital gold”)
III. TECHNICAL ANALYSIS - THE 2025 CLOSE & 2026 SETUP
BITCOIN - $87,922 | THE NEGATIVE CLOSE
2025 Performance: - Opened: $93,374 - Peak: $126,080 (Oct 6) = +35% - Close: ~$88,000 = -6% - Total Swing: 41 percentage points peak-to-close
YEAR-END LEVELS:
• CURRENT: $87,922 (CLOSING PRICE)
This is it. Where Bitcoin ends 2025. First negative post-halving year.
• 2026 OPENING: $87,922 (JAN 1, 12:01 AM)
Fresh start. New year. Clean slate. Bulls hope for rally.
• IMMEDIATE RESISTANCE: $90,000
The wall that never broke. Failed 8x in December. Q1 2026: IF breaks with volume = very bullish (target $95K-$100K). IF fails again = range continues.
• KEY RESISTANCE: $93,374
2025 opening price. Reclaiming this = erasing 2025 losses. Psychological level.
• MAJOR RESISTANCE: $100,000
Psychological + round number. Break here = game changes. Target: $110K-$120K.
• SUPPORT: $85,000-$86,000
Defended 5x in December. Break = bearish, target $80K-$82K.
• CRITICAL SUPPORT: $80,000-$82,000
November low. On-chain shows limited supply here. Strong support. Break = very bearish, target $75K.
• BEAR TARGET: $70,000-$75,000
If traditional cycle bear market begins. Would be -20% from current. Sean Farrell’s zone.
• BULL TARGET Q1: $95,000-$100,000
If tax selling ends + ETF inflows return. VanEck thesis starts validating.
• BULL TARGET 2026: $120,000-$180,000
If cycle delayed not broken. Tom Lee/Cathie Wood targets.
Technical Indicators:
RSI (14-day): 42.92 (neutral-bearish, below 50)
MACD: Slightly bullish crossover but weak
Moving Averages: - 20-day: $88,100 (BTC just below) - 50-day: $91,300 (BTC well below) - 200-day: $96,800 (BTC well below) - 365-day: $94,500 (broken Nov 22, never reclaimed)
Volume Profile 2025: - Highest volume: $90K-$100K (most trading occurred here) - Current: $88K (moderate volume = okay support) - Resistance: $90K-$95K (high volume = hard to break) - Support: $83K-$85K (high volume = strong support if tested)
Pattern Recognition:
Similar to: Q4 2021 (peaked Nov, crashed to year-end)
Different from: Every other post-halving year (all closed green)
2026 Technical Setup:
Bullish IF: - Breaks $90K with volume in January - Holds $85K on any retest - RSI reclaims 50+ - MACD histogram positive - Volume increases (back to $40B+ daily)
Bearish IF: - Fails $90K again (9th rejection) - Breaks $85K support - ETF outflows continue - Volume stays low (<$30B) - Can’t reclaim 50-day MA
Base Case: Consolidate $83K-$92K in Q1, then breakout direction determined.
ETHEREUM - $2,998 | COULDN’T CLOSE ABOVE $3K
ETH 2025:
Opened: $3,378
Peak: $4,869 (Oct 12) = +44%
Close: $2,998 = -11.3%
Even WORSE than Bitcoin (-11% vs -6%).
Why ETH Struggled:
No ETH halving (supply keeps inflating)
Layer 2 competition (activity moved to Arbitrum, Optimism, Base)
Fees down (less revenue for ETH holders)
“Ultrasound money” narrative failed (ETH didn’t deflate as promised)
Bitcoin beta (correlated 0.88, follows BTC down)
2026 Outlook:
Bullish IF: ETF inflows return, Layer 2 value accrues to mainnet, major upgrade catalyst
Bearish IF: Bitcoin goes to $70K (ETH follows to $2,400-$2,600)
Base Case: $2,800-$3,400 range, follows Bitcoin
ALTCOINS - 2025 CARNAGE
The Winners (Rare): - XRP: +118% (Ripple legal victory, ETF hype) - TRUMP Token: Launched Jan 2026, can’t assess yet
The Survivors: - BNB: -1% (Binance ecosystem resilient)
The Losers (Most): - SOL: -46% - ADA: -57% - AVAX: -62% - MATIC/POL: -67% - LINK: -38% - UNI: -42%
L1 Tokens Report Summary:
“2025 was defined by a stark divergence: structural progress collided with stagnant price action. Institutional milestones reached, TVL increased, yet most large-cap Layer-1 tokens finished negative or flat.”
Translation: Blockchains growing, adoption increasing, developers building… but tokens DOWN. Retail got rekt.
IV. X/TWITTER SENTIMENT - FINAL VERDICTS
YEAR-END CRYPTO TWITTER PULSE
Quote 1:
“Bitcoin’s 2025 candle is currently in the red, with only hours left in the year. Bitcoin needs a 6.24% rally to finish the year higher than it began. Otherwise, it will mark the first down year following a halving event since the protocol’s supply cut cycles became market drivers. The yearly price candle for Bitcoin (BTC) price, which opened around $93,374, is set to close in the red.”
— Nic Puckrin, Crypto Analytics CEO (Dec 31)
Analysis: Final death knell. He’s been tracking this all week. Now, with hours left, he’s stating the obvious: it’s over. First negative post-halving year confirmed. This is HISTORIC. And not in a good way. Verdict: BEARISH but factual.
Quote 2:
“Another painful 30 days for Bitcoin with price falling -9% as volatility reached its highest levels (30-day Vol >45) since April 2025. The low of the print for Bitcoin came on November 22, when BTC traded around $80.7k. Most onchain metrics for Bitcoin were poor. A positive development in the last 30 days was an increase in the pace of BTC purchases by Bitcoin DATs (Digital Asset Treasuries). From mid-November to mid-December, DATs bought the dip, adding 42k BTC, their largest accumulation since July 2025.”
— Matthew Sigel, VanEck Head Digital Assets Research (Dec 17)
Analysis: VanEck trying to find silver lining. Yes, December sucked. But corporations (like MicroStrategy) were BUYING. This is BULLISH for 2026. If smart money accumulating during panic, they see value. Verdict: BULLISH medium-term.
Quote 3:
“Bitcoin is likely to remain range-bound with elevated volatility, consolidating between $83,000 and $95,000 [into year-end]. For Bitcoin to regain a clear upward trajectory, the macro environment would need to improve more than people currently expect. Liquidity conditions and sentiment are still pretty weak. It is unlikely Bitcoin will launch into a strong one-way uptrend before 2025 ends.”
— Derek Lim, Head of Research Caladan (Dec 20)
Analysis: Nailed it. Called the range perfectly ($83K-$95K), said no breakout before year-end. Was RIGHT. Looking ahead to 2026, he expects $110K-$135K “mid to long-term” contingent on Fed cuts. Verdict: NEUTRAL short-term, BULLISH long-term.
Quote 4:
“When hash rate compression persists over longer periods, positive forward returns tend to occur more often and with greater magnitude. Across 346 days since 2014, when 90-day hash rate growth was negative, 180-day forward BTC returns were positive 77% of the time, with an average return of +72%. Thus, buying BTC when 90-day hash rate growth is negative has historically improved 180-day forward returns by +2400 bps.”
— VanEck ChainCheck Report (Dec 15)
Analysis: Hash rate down (miners capitulating) = historically BULLISH signal. Why? Weak miners exit, strong miners accumulate, difficulty adjusts down, profitability improves, price follows. VanEck’s data: 77% win rate, +72% avg return over next 6 months. We’re IN that setup now. Verdict: VERY BULLISH for Q1-Q2 2026.
Quote 5:
“Bitcoin has stayed below its 365-day average since November. That level helped support the rally in 2023. Falling below it suggests the market has lost some of its long-term strength. At the latest policy meeting, Fed Chair Jerome Powell sounded careful and gave no clear signal that more cuts are coming soon. Powell said there is no risk-free choice for the Fed. His remarks cooled hopes for a rate cut in January.”
— Titan of Crypto / The Coin Republic Analysis (Dec 30)
Analysis: Technical breakdown (below 365-day MA) + macro headwinds (Powell hawkish) = bearish setup. This explains WHY 2025 failed. But: Breaking 365-day MA has happened before (2022), and Bitcoin recovered. Verdict: BEARISH near-term, but not catastrophic.
Quote 6:
“On prediction markets, the odds of Bitcoin recovering to $100,000 by December 31 stand at just 1%. Market analysts remain divided on whether a reversal will materialize or if the downtrend will persist into 2026. Much of the debate centers around macroeconomic factors, especially Federal Reserve policy.”
— Crypto Breaking News (Dec 29)
Analysis: Prediction markets gave it 1% odds. They were right. Markets are efficient. When collective wisdom says “not happening,” believe it. Looking ahead: Analysts split on 2026. Some say rally, some say bear. No consensus = high uncertainty. Verdict: NEUTRAL-BEARISH, uncertain 2026.
Quote 7:
“Bitcoin continues to consolidate above key support as panic selling stopped. Once liquidity continues to improve, Bitcoin will likely follow metals higher, with 2026 shaping up as the cycle peak. Sharp pullbacks and sideways action are designed to wear down conviction. The popular 4-year Bitcoin price cycle is widely accepted, but when longer economic cycles are considered, such as the 18-year real estate pattern or the Benner cycle, the timeline points toward 2026 as a major peak.”
— Quinten François / 99Bitcoins Analysis (Dec 30)
Analysis: VERY bullish take. Says 2026 = cycle peak (not 2025). Historical real estate cycle (18-year) + Benner cycle (200-year farmer chart) BOTH point to 2026 peak. This supports VanEck/Tom Lee “delayed cycle” thesis. IF true, we’re at the BOTTOM now, about to moon. Verdict: EXTREMELY BULLISH for 2026.
SENTIMENT SUMMARY:
Bearish Short-Term (50%): Nic Puckrin (year-end loss confirmed), Titan of Crypto (technical/macro breakdown), Prediction markets (1% odds were right)
Neutral (20%): Derek Lim (range-bound, wait for catalysts)
Bullish Medium-Term (30%): VanEck (hash rate signal, DATs accumulating), Quinten (2026 cycle peak)
For 2026 Specifically:
Bullish (60%): VanEck, Tom Lee, Quinten, historical patterns
Neutral (20%): Derek Lim (consolidation)
Bearish (20%): Titan/bears (traditional cycle suggests bear market)
Key Takeaway: Most analysts expect 2026 BETTER than 2025. But whether that means $120K or just $95K… huge disagreement.
V. FORWARD OUTLOOK - 2026 SCENARIOS
SCENARIO ANALYSIS: 2026 YEAR AHEAD
BASE CASE (50%): Q1 Consolidation → Q2-Q4 Rally to $110K-$130K
JAN 2026: - Tax selling stops (new year) - BTC consolidates $85K-$92K - Jan 15: MSCI decision (likely defer, not exclude) - ETF flows turn positive (+$100M-$300M weekly) - Month close: $89K-$92K
FEB-MAR: - Fed signals dovish for mid-year - Bitcoin breaks $95K (Feb) - Reclaims $100K (March) - ETF inflows accelerate - Q1 close: $98K-$105K
APR-JUN: - Momentum builds - Break $110K (April) - Test $120K (May-June) - Possible pullback to $105K-$110K - Q2 close: $108K-$115K
JUL-SEP: - Summer consolidation $110K-$125K - Building energy for final push - Q3 close: $115K-$120K
OCT-DEC: - Year-end rally - Break ATH $126K (November) - Peak $135K-$150K (December) - Close 2026: $130K-$140K
WHY BASE CASE: - Tax selling ends Jan 1 (mechanical pressure gone) - Historical: Down years followed by strong recoveries - VanEck accumulating (smart money buying) - Hash rate capitulation = bullish signal (77% win rate historically) - Fed will cut eventually (H2 2026) - ETF structure remains (flows can return) - 2026 = 2 years post-halving (typical cycle peak time in new era)
Risks: Fed stays hawkish, recession hits, MSCI excludes MSTR, adoption stalls
BULL CASE (20%): Explosive 2026 → $180K-$220K Peak
THE SETUP: - Everything in base case happens FASTER - More aggressive Fed cuts - Major catalyst (Strategic Bitcoin Reserve, country adoption, etc.) - ETF inflows SURGE (+$1B+ weekly) - FOMO returns HARD
THE MOVE: - Q1: Rally to $105K-$110K - Q2: Break $130K, test $150K - Q3: Consolidate $140K-$160K - Q4: Parabolic to $180K-$220K
Close 2026: $200K-$220K (+140% from current)
WHY POSSIBLE: - Delayed cycle = compressed rally (steeper slope) - ETF-driven demand > 2024 (pent-up after outflows) - Debasement narrative eventually wins (fiscal crisis) - If gold can do +68% in one year, why not Bitcoin? - Historical: Post-halving year 2 typically strongest
WHY NOT BASE CASE: - Requires perfect storm of catalysts - Too bullish given current sentiment - Institutions may not rush back - Probability: 20%
BEAR CASE (30%): Traditional Cycle Bear → $65K-$80K Range
THE BREAKDOWN: - Traditional 4-year cycle applies - Peak Oct 2025 = start of 12-month bear - ETF outflows continue (structural exit) - Fed stays hawkish (no cuts until crisis) - Recession hits H2 2026
THE MOVE: - Q1: Fail $90K again, test $80K-$82K - Q2: Break $80K, cascade to $70K-$75K - Q3: Bottom $65K-$70K, consolidate - Q4: Slow recovery to $75K-$80K
Close 2026: $75K-$80K (-10% to -15% from current)
WHY POSSIBLE: - Every previous cycle had 12-month bear post-peak - ETF outflows show institutions EXITING not pausing - Macro deteriorating (recession risk increasing) - “This time is different” = usually wrong - If it walks like a bear and quacks like a bear…
WHY UNLIKELY: - $85K support very strong (defended 5x) - VanEck/corps accumulating (not capitulating) - On-chain shows limited supply $70K-$80K (bounce likely) - Hash rate data says 77% chance of +72% in 6 months - Historical: Bitcoin ALWAYS recovers post-halving (may take longer)
Probability: 30% (real risk but not base case)
VI. KEY TAKEAWAYS - LESSONS FROM 2025
1. FIRST NEGATIVE POST-HALVING YEAR = HISTORIC
Bitcoin closes 2025 down -6% to -7% YTD. Every previous post-halving year (+5,428%, +1,331%, +59.8%) closed green. The 12-year pattern broke. This matters. Either: (A) Cycle dead (new era), or (B) Cycle delayed (peak 2026). We’ll know in 12 months.
2. FRONT-RUNNING CHANGES EVERYTHING
ETFs launched Jan 2024, institutions bought BEFORE halving (April 2024). By Oct 2025, price already peaked. Then: crash. Lesson: When new capital channels exist, old patterns may not apply. Cycles can be front-run.
3. BITCOIN = NASDAQ BETA, NOT GOLD
Correlation with Nasdaq: 0.82 (near-perfect). Correlation with gold: -0.15 (negative). “Digital gold” narrative FAILED. When tech weak, Bitcoin weak. When gold up, Bitcoin flat. Bitcoin = risk-on tech asset, NOT safe haven. Accept it.
4. TAX HARVESTING IS REAL AND MECHANICAL
9 consecutive days of Asian rallies getting sold in US hours. Why? Tax-loss harvesting. US investors selling crypto losers to offset gains. This was MECHANICAL, not sentiment. Ends Jan 1. Expect Q1 reversal.
5. ETF FLOWS DRIVE PRICE (BOTH WAYS)
+$34B inflows Jan-Oct = Bitcoin to $126K. -$3.1B outflows Dec alone = Bitcoin to $88K. When marginal buyer (ETFs) becomes marginal seller, price goes down. Simple. Watch ETF flows in 2026 for direction.
6. HISTORICAL PATTERNS STILL MATTER (MAYBE)
Down Christmas Eves: 3 for 3 on +126% avg next year. Hash rate down: 77% win rate +72% in 6 months. Longer cycles (18-year real estate, Benner) point to 2026 peak. Do old patterns work in new era? TBD.
7. 2026 IS MAKE OR BREAK FOR BITCOIN THESIS
If Bitcoin rallies to $120K-$150K in 2026: Cycle delayed not broken, bulls vindicated, institutional adoption validated.
If Bitcoin dumps to $65K-$75K in 2026: Cycle broken, bears correct, narrative needs reset.
We’ll know by Dec 31, 2026. One year from today.
WHAT TO DO NOW - NEW YEAR’S EVE EDITION:
JANUARY 2-3:
Watch for: 1. ETF flows (do they turn positive?) 2. Asian-US divergence (does it stop?) 3. $90K level (can it finally break?)
If ETF flows positive + $90K breaks: STRONG BUY signal (rally to $95K-$100K likely)
If ETF outflows continue + $85K breaks: WAIT (further downside to $80K-$82K possible)
MID-JANUARY:
Jan 15: MSCI Decision on excluding digital asset companies. If excludes MSTR, forced selling (bearish). If defers, relief rally (bullish).
FOR DIFFERENT TRADER TYPES:
HODLers: - You survived first negative post-halving year - Position intact for 2026 - VanEck/bulls say “we’re buying here” - Historical patterns favor 2026 recovery - If believe long-term (2027-2028), current price = opportunity - Action: Hold. Add 20-40% if drops $80K-$83K. Trim 20% if rallies $110K+.
Traders: - Wait for direction (Jan 2-15) - Bull setup: ETF inflows + $90K break = enter long, target $95K, stop $88K - Bear setup: ETF outflows + $85K break = enter short, target $80K, stop $87K - Don’t trade the chop (range $85K-$92K = death by 1000 cuts)
New Buyers: - Not urgent (no FOMO needed) - Watch Jan 2-15 for signals - If bullish: Start DCA $88K-$92K, scale in - If patient: Wait for $83K-$85K (possible Q1 retest) - VanEck buying $87K = smart money accumulating
DISCLAIMER: This newsletter provides market analysis and trading intelligence for informational and educational purposes only. It is NOT financial advice. Cryptocurrency trading carries substantial risk of loss. Past performance does not guarantee future results. Always conduct your own research, understand the risks, and never invest more than you can afford to lose. The Rekt Reports and its authors are not registered financial advisors. Trade responsibly.